SAS programs/ exercises - Chap 7 to 15 (Learn SAS by examples by Ron Cody)
In all the program permanent libraries are used. Following are two links to download the SAS programs, datasets and the libraries.
ProgramsAndDatasets
Libraries
1) Using the Bicycles data set, list all the observations for Road Bikes that cost more
than $2,500 or Hybrids that cost more than $660. The variable Model contains the
type of bike and UnitCost contains the cost
The SAS program is as follows.
libname B14003 '/folders/myfolders/Assignment/B14003';
title "Selected Observations from BICYCLES";
proc print data=B14003.B03_bicycles noobs;
where Model eq "Road Bike" and UnitCost gt 2500 or
Model eq "Hybrid" and UnitCost gt 660;
run;
We first create the permanent library using the bicycle dataset. In the proc print step we define the condition (road Bikes that cost more than $2,500 or Hybrids that cost more than $660) using the where statement. eq means equal to and gt means greater than. Only those observations will be printed that meet the condition. Running this proc print procedure will list all the observations for Road Bikes that cost more than $2,500 or Hybrids that cost more than $660. The variable Model contains the type of bike and UnitCost contains the cost of each unit.
The output for the above program is as follows.
2) Starting with the Blood data set, create a new, temporary SAS data set containing
all the variables in Blood plus a new variable called CholGroup. Define this new
variable as follows:
CholGroup Chol
Low Low – 110
Medium 111 – 140
High 141 – High
Use a SELECT statement to do this
The SAS program is as follows.
libname B14003 '/folders/myfolders/Assignment/B14003';
data B14003.B03_bloodcholgroup;
set B14003.B03_blood;
length CholGroup $ 6;
select;
when (missing(Chol)) CholGroup = ' ';
when (Chol le 110) CholGroup = 'Low';
when (Chol le 140) CholGroup = 'Medium';
otherwise CholGroup = 'High';
end;
run;
title "Listing of BLOOD";
proc print data=B14003.B03_bloodcholgroup noobs;
run;
Using the blood dataset we create the bloodcholgroup dataset. The length statement specifies the length of the dataset variable. We create the new dataset bloodcholgroup using the select statement (which is used to execute a group of statements/ one of several statements). The when statement is used to execute statements when a particular condition is met. Here the conditions are:
- when (missing(Chol)) CholGroup = ' ';
- when (Chol le 110) CholGroup = 'Low';
- when (Chol le 140) CholGroup = 'Medium';
- otherwise CholGroup = 'High';
le is less than or equal to.
The proc print step is used to list the observations of the bloodcholgroup dataset.
The output for the above program is as follows. As the result is an extremely large set of observations, I am showing only a part of the output.
3) You have the following seven values for temperatures for each day of the week,
starting with Monday: 70, 72, 74, 76, 77, 78, and 85. Create a temporary SAS data
set (Temperatures) with a variable (Day) equal to Mon, Tue, Wed, Thu, Fri, Sat, and
Sun and a variable called Temp equal to the listed temperature values. Use a DO
loop to create the Day variable.
The SAS program is as follows.
libname B14003 '/folders/myfolders/Assignment/B14003';
data B14003.B03_temperatures;
do Day = 'Mon','Tues','Wed','Thu','Fri','Sat','Sun';
input Temp @;
output;
end;
datalines;
70 72 74 76 77 78 85
;
title "Listing of TEMPERATURES";
proc print data=B14003.B03_temperatures noobs;
run;
In the data step we first use a do loop using Day as the indexed variable. The values of indexing Day variable for the iterations of the do loop are 'Mon','Tues','Wed','Thu','Fri','Sat','Sun'. For each iteration of the do loop we, the Temp variable is used to hold the input data specified by the datalines statement. the @ symbol after the Temp variable holds the line after each input from the datalines and prevents the pointer from jumping to the second line after one temperature data is read. The @ symbol is used in case data is specified in a single line in the datalines step. The output statement writes the current observation in the sas data set. The end statement specifies the end of the do loop.
The proc print step lists the observations for the temperature dataset (temperature for each day of the week, i.e 'Mon','Tues','Wed','Thu','Fri','Sat','Sun'will be displayed).
The output for the above program is as follows.
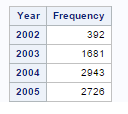
4) Using the Hosp data set, compute the frequencies for the days of the week, months of
the year, and year, corresponding to the admission dates (variable AdmitDate).
Supply a format for the days of the week and months of the year. Use PROC FREQ to
list these frequencies
The SAS program is as follows.
libname B14003 '/folders/myfolders/Assignment/B14003';
data B14003.B03_freq;
set B14003.B03_hosp(keep=AdmitDate);
Day = weekday(AdmitDate);
Month = month(AdmitDate);
Year = year(AdmitDate);
run;
proc format;
value days 1='Sun' 2='Mon' 3='Tue'
4='Wed' 5='Thu' 6='Fri'
7='Sat';
value months 1='Jan' 2='Feb' 3='Mar'
4='Apr' 5='May' 6='Jun'
7='Jul' 8='Aug' 9='Sep'
10='Oct' 11='Nov' 12='Dec';
run;
title "Frequencies for Hospital Admissions";
proc freq data=B14003.B03_freq;
tables Day Month Year / nocum nopercent;
format Day days. Month months.;
run;
The data set freq is created from the hosp dataset. The set statement reads observation from the hosp dataset. The keep statement specifies the vaiable from the hosp dataset that is to be processed. The statements Month = month(AdmitDate) and Year = year(AdmitDate) extracts the year and month from the variable AdmitDate and stores them in Month and Year variables respectively.
In the proc format step the value statement creates format that specifes the characters to be used while printing a variable. The formats for the days and month variable is shown in the code.
The title statement before the proc print step specifies the tile that would be printed over the output table. The proc freq step the table statement requests one-way to n-way frequency and crosstabulation tables and statistics for those tables. The variables whose frequence need to be computed are Day, Month and Year. The nocum statement omits the display of cumulative frequencies and the nopercent statement omits the display of overall percentages. The format statement associates the formats for the variables.
The output for the above program is as follows.
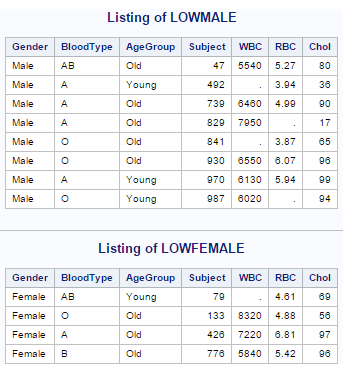
5) Using the SAS data set Blood, create two temporary SAS data sets by selecting all
subjects with cholesterol levels (Chol) below 100. Place the male subjects in
Lowmale and the female subjects in Lowfemale. Do this using a single DATA step.
Note: Values for Gender are Male and Female
The SAS program is as follows.
libname B14003 '/folders/myfolders/Assignment/B14003';
data B14003.B03_lowmale B14003.B03_lowfemale;
set B14003.B03_blood;
where Chol lt 100 and Chol is not missing;
if Gender = 'Female' then output B14003.B03_lowfemale;
else if Gender = 'Male' then output B14003.B03_lowmale;
run;
title "Listing of LOWMALE";
proc print data=B14003.B03_lowmale noobs;
run;
title "Listing of LOWFEMALE";
proc print data=B14003.B03_lowfemale noobs;
run;
We create two datasets lowmale and lowfemale from the master dataset blood. The male sujects with cholestrol level below 100 is placed in lowmale dataset and the female sujects with cholestrol level below 100 is placed in lowfemale dataset. In the datastep the set statement is used to read observations from the blood dataset. We use the following condition in the data step.
- where Chol lt 100 and Chol is not missing;
- if Gender = 'Female' then output B14003.B03_lowfemale;
- else if Gender = 'Male' then output B14003.B03_lowmale;
The condition (cholestrol less than 100 and is not missing) is specified using the where statement. lt means less than. Only those observations from the blood dataset will be selected that meet the condition (cholestrol less than 100 and is not missing). The output statement writes the current observation to the dataset. If the where condition is satisfied and the gender is male the the observation will be written to lowmale datastet. If the where condition is satisfied and the gender is female the the observation will be written to lowfemale datastet.The proc print steps are used to list the observations of the lowmale and lowfemale datasets.
The output of the above program is as follows.
6) Create a new, temporary SAS data set (Miss_Blood) based on the SAS data set
Blood. Set Gender, RBC, and Chol to a missing value if WBC is missing. Use the
MISSING and CALL MISSING functions in this program
The SAS program is as follows.
libname B14003 '/folders/myfolders/Assignment/B14003';
data B14003.B03_miss_blood;
set B14003.B03_blood;
if missing(WBC) then call missing(Gender,RBC, Chol);
run;
title "Listing of MISS_BLOOD";
proc print data=B14003.B03_miss_blood noobs;
run;
Here a SAS data set (miss_blood) based on the SAS data set blood. The set statement specifies that the observations will be read from the blood data set. The if condition specifies that if the WBC value for a particular observation is missing then the missing function will be called with (Gender,RBC,Chol) as the parameters. This means that for an observation if WBC has a missing value then the RBC, Gender and Chol values will be replaced with missing values for that particular observation.The proc print step is used to list the observations of the miss_blood data set.
The output for the above program is as follows. The output for the above program is as follows. As the result is an extremely large set of observations, I am showing only a part of the output.
7) Using the Sales data set, create a temporary SAS data set (Spirited) containing all the
observations from Sales where the string (not necessarily the word) SPIRIT in either
upper-, lower-, or mixed case is part of the Customer value (variable name
Customer)
The SAS program is as follows.
libname B14003 '/folders/myfolders/Assignment/B14003';
data B14003.B03_spirited;
set B14003.B03_sales;
where find(Customer,'spirit','i');
run;
title "Listing of SPIRITED";
proc print data=B14003.B03_spirited noobs;
run;
The spirited dataset is created from the sales dataset. The set statement is used to read observations from the sales dataset. The where statement specifies which observations will be read from sales dataset. The conditon for the where statement is all the observations from sales where the string (not necessarily the word) SPIRIT in either upper-, lower-, or mixed case is part of the Customer value. This is specfied by calling the find function - find(Customer,'spirit','i'). The first parameter Customer specifies the variable of the sales dataset in which we are interested. The second parameter is the variable we need no search, i.e. 'spirit'. The third parameter specifies that the 'spirit' can be in upper, lower or mixed case. The proc print step lists the observations for the spirited dataset.
The output of the above program is as follows.
8) The passing score on each of five tests is 65, 70, 60, 62, and 68. Using the data here,
use a temporary array to count the number of tests passed by each student
ID Test 1 Test 2 Test 3 Test 4 Test 5
001 90 88 92 95 90
002 64 64 77 72 71
003 68 69 80 75 70
004 88 77 66 77 67;
The SAS program is as follows.
libname B14003 '/folders/myfolders/Assignment/B14003';
data B14003.B03_passing;
array pass_score{5} _temporary_
(65,70,60,62,68);
array Score{5};
input ID : $3. Score1-Score5;
NumberPassed = 0;
do Test = 1 to 5;
NumberPassed + (Score{Test} ge pass_score{Test});
end;
drop Test;
datalines;
001 90 88 92 95 90
002 64 64 77 72 71
003 68 69 80 75 70
004 88 77 66 77 67
;
title "Listing of PASSING";
proc print data=B14003.B03_passing;
id ID;
run;
First we define an array of 5 elements, pass_score, which stores the minium passing marks for the five subjects. Next we define an array Score to store the marks of 5 subjects. We input the scores of 5 subjects for each student ID. In the do loop we use the index variable Test wose values ranges from 1 to 5. Each test score for each student is compared with the minimum pass marks (stored in array pass_score) and if the score obtained is greater than score passed then the variable NumberPassed for each student ID is incremented by 1. The proc print step is used to list the observations of the passing dataset.
The output for the above program is as follows.
9) List the first 10 observations in data set Blood. Include only the variables Subject,
WBC (white blood cell), RBC (red blood cell), and Chol. Label the last three
variables “White Blood Cells,” “Red Blood Cells,” and “Cholesterol,” respectively.
Omit the Obs column, and place Subject in the first column. Be sure the column
headings are the variable labels, not the variable names
The SAS program is as follows.
libname B14003 '/folders/myfolders/Assignment/B14003';
title "First 10 Observations in BLOOD";
proc print data=B14003.B03_blood(obs=10) label;
id Subject;
var WBC RBC Chol;
label WBC = 'White Blood Cells'
RBC = 'Red Blood Cells'
Chol = 'Cholesterol';
run;
In the proc print step we use the obs=10 to specify that only the first 10 observations of the blood dataset will be displayed. We use the id statement identify the observations by variable Subject instead of observation numbers. The label statement is used to assign descriptive labels to variables WBC, RBC abd Chol.
The output for the above program is as follows.
10) Using the SAS data set Blood, produce a report showing the mean cholesterol (Chol)
for each combination of Gender and blood type (BloodType). Your report should
look like this:
Mean Cholesterol by Gender and Blood Type
Blood Mean
Gender Type Cholesterol
Female A 201.4
AB 166.5
B 208.1
O 205.6
Male A 201.5
AB 191.2
B 211.1
O 197.9
The SAS program is as follows.
title "Mean Cholesterol by Gender and Blood Type";
proc report data=B14003.B03_blood;
column Gender BloodType Chol;
define Gender / group width=6;
define BloodType / group "Blood Type" width=5;
define Chol / analysis mean "Mean Cholesterol"
width=11 format=5.1;
run;
quit;
We use the blood dataset. In the proc report step we first use the column statement to specify the arrangement of columns in the output. The define statement describes how to use and display a report item. The group statement defines report-item, which must be a data set variable, as a group variable. The width statement defines the width of the column.The analysis statement defines report-item, which must be a data set variable, as an analysis variable. The mean statement specifies that the mean of the variable should be displayed.
The output for the above SAS program is as follows.