SAS programs/ exercises - Chap 15, 17 and 20 (Learn SAS by examples by Ron Cody)
In all the program permanent libraries are used. Following are two links to download the SAS programs, datasets and the libraries.
Programs
PermanentDatasetsAndLibraries
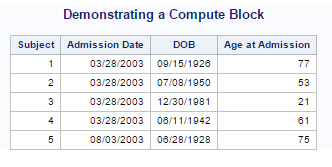
Chapter 15 Question 3: Question 3 : Using the Hosp data set, create the report shown here. Age should be computed using
the YRDIF function and rounded to the nearest integer:
Demonstrating a COMPUTE Block
Admission Age at
Subject Date DOB Admission
1 03/28/2003 09/15/1926 77
2 03/28/2003 07/08/1950 53
3 03/28/2003 12/30/1981 21
4 03/28/2003 06/11/1942 61
5 08/03/2003 06/28/1928 75
The SAS program is as follows.
libname B14003 '/folders/myfolders/Assignment/B14003';
title "Demonstrating a Compute Block";
proc report data=B14003.B03_hosp(obs=5) nowd headline;
column Subject AdmitDate DOB Age;
define AdmitDate / display "Admission Date" width=10;
define DOB / display;
define Subject / display width=7;
define Age / computed "Age at Admission" ;
compute Age;
Age = round(yrdif(DOB,AdmitDate,'Actual'));
endcomp;
run;
quit;
Program in SAS studio looks like this

Chapter 17 Question 1 : Using the SAS data set Blood, generate one-way frequencies for the variables Gender, BloodType, and AgeGroup. Use the appropriate options to omit the
cumulative statistics and percentages
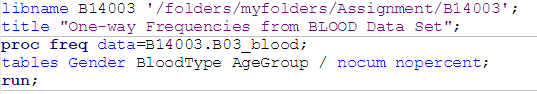
The SAS program is as follows.
libname B14003 '/folders/myfolders/Assignment/B14003';
title "One-way Frequencies from BLOOD Data Set";
proc freq data=B14003.B03_blood;
tables Gender BloodType AgeGroup / nocum nopercent;
run;
Program in SAS studio looks like this
We use the blood dataset.The TABLES statement requests one-way to n-way frequency and crosstabulation tables and statistics for those tables and the frequencey of the variables Gender BloodType AgeGroup are computed. The nocum statement suppresses the display of cumulative frequencies and percentages in one-way frequency tables. The nopercent suppresses the display of overall percentages in cross tabulation tables.
The output for the above SAS program is as follows.

Chapter 17 Question 3 : Using the data set Blood, produce frequencies for the variable Chol (cholesterol).
Use a format to group the frequencies into three groups: low to 200 (normal), 201
and higher (high), and missing. Run PROC FREQ twice, once using the MISSING
option, and once without. Compare the percentages in both listings.
The SAS program is as follows.
libname B14003 '/folders/myfolders/Assignment/B14003';
proc format;
value cholgrp low-200 = 'Normal'
201-high = 'High'
. = 'Missing';
run;
title "Demonstrating the MISSING Option";
title2 "Without MISSING Option";
proc freq data=B14003.B03_blood;
tables Chol / nocum;
format Chol cholgrp.;
run;
title "Demonstrating the MISSING Option";
title2 "With MISSING Option";
proc freq data=B14003.B03_blood;
tables Chol / nocum missing;
format Chol cholgrp.;
run;
Program in SAS studio looks like this

We use the blood dataset. We first create the formats normal and high for the cholgrp in the proc format step. The first proc freq step computes the frequency of the cholgrp without taking into account the missing values. The nocum statement suppresses the display of cumulative frequencies and percentages in one-way frequency tables. The format statement associates formats with the variable cholgrp. In the second proc freq step the frequency of the missing values is also computed. The missing statement treats missing values as a valid nonmissing level for all TABLES variables. The nocum statement suppresses the display of cumulative frequencies and percentages in one-way frequency tables. The format statement associates formats with the variable cholgrp.
The output for the above SAS program is as follows

Chapter 17 Question 7 : Using the SAS data set Blood, produce a table of frequencies for BloodType, in frequency order.
The SAS program is as follows.
libname B14003 '/folders/myfolders/Assignment/B14003';
title "Blood Types in Decreasing Frequency Order";
proc freq data=B14003.B03_blood order=freq;
tables BloodType / nocum nopercent;
run;
Program in SAS studio looks like this

We use the blood dataset.In the proc freq step we compute the frequencies of the varibale BloodType. The nocum statement suppresses the display of cumulative frequencies and percentages in one-way frequency tables. The nopercent suppresses the display of overall percentages in crosstabulation tables. The order statement Specifies the order of the variable levels in the frequency and crosstabulation tables, which you request in the TABLES statement.
The output of the above SAS program is as follows.

Chapter 20 Question 5 : Using the SAS data set Bicycles, produce a vertical bar chart showing a frequency distribution of State. Within each bar, show the distribution of Model.
The SAS program is as follows.
libname B14003 '/folders/myfolders/Assignment/B14003';
title "Distribution of Sales by Model";
proc sgplot data=B14003.B03_bicycles;
vbar State / group = Model;
run;
quit;
Program in SAS studio looks like this

We use the bicycles dataset. The proc sgplot step is used to create the charts. The vbar statement creates a vertical bar chart that summarizes the values of a category variable State. The group statement specifies a variable that is used to group the data. The plot elements for each group value are automatically distinguished by different visual attributes. In this case it is grouped by the variable Model.
The output for the SAS program is as follows.

In all the program permanent libraries are used. Following are two links to download the SAS programs, datasets and the libraries.
Programs
PermanentDatasetsAndLibraries
Chapter 15 Question 3: Question 3 : Using the Hosp data set, create the report shown here. Age should be computed using
the YRDIF function and rounded to the nearest integer:
Demonstrating a COMPUTE Block
Admission Age at
Subject Date DOB Admission
1 03/28/2003 09/15/1926 77
2 03/28/2003 07/08/1950 53
3 03/28/2003 12/30/1981 21
4 03/28/2003 06/11/1942 61
5 08/03/2003 06/28/1928 75
The SAS program is as follows.
libname B14003 '/folders/myfolders/Assignment/B14003';
title "Demonstrating a Compute Block";
proc report data=B14003.B03_hosp(obs=5) nowd headline;
column Subject AdmitDate DOB Age;
define AdmitDate / display "Admission Date" width=10;
define DOB / display;
define Subject / display width=7;
define Age / computed "Age at Admission" ;
compute Age;
Age = round(yrdif(DOB,AdmitDate,'Actual'));
endcomp;
run;
quit;
Program in SAS studio looks like this
We again use the Hosp dataset. In the proc report step the define statement describes how to use and display a report item. The column statement describes the arrangement of all columns and of headings that span more than one column. The width statement defines the width of the column in which PROC REPORT displays report-item. The age at admission is computed by rounding of the year difference between the joining date and DOB. The endcomp statement Marks the end of one
or more programming statements that PROC REPORT executes as it builds the report.
The output of the SAS program is as follows.
Chapter 17 Question 1 : Using the SAS data set Blood, generate one-way frequencies for the variables Gender, BloodType, and AgeGroup. Use the appropriate options to omit the
cumulative statistics and percentages
The SAS program is as follows.
libname B14003 '/folders/myfolders/Assignment/B14003';
title "One-way Frequencies from BLOOD Data Set";
proc freq data=B14003.B03_blood;
tables Gender BloodType AgeGroup / nocum nopercent;
run;
Program in SAS studio looks like this
We use the blood dataset.The TABLES statement requests one-way to n-way frequency and crosstabulation tables and statistics for those tables and the frequencey of the variables Gender BloodType AgeGroup are computed. The nocum statement suppresses the display of cumulative frequencies and percentages in one-way frequency tables. The nopercent suppresses the display of overall percentages in cross tabulation tables.
The output for the above SAS program is as follows.
Chapter 17 Question 3 : Using the data set Blood, produce frequencies for the variable Chol (cholesterol).
Use a format to group the frequencies into three groups: low to 200 (normal), 201
and higher (high), and missing. Run PROC FREQ twice, once using the MISSING
option, and once without. Compare the percentages in both listings.
The SAS program is as follows.
libname B14003 '/folders/myfolders/Assignment/B14003';
proc format;
value cholgrp low-200 = 'Normal'
201-high = 'High'
. = 'Missing';
run;
title "Demonstrating the MISSING Option";
title2 "Without MISSING Option";
proc freq data=B14003.B03_blood;
tables Chol / nocum;
format Chol cholgrp.;
run;
title "Demonstrating the MISSING Option";
title2 "With MISSING Option";
proc freq data=B14003.B03_blood;
tables Chol / nocum missing;
format Chol cholgrp.;
run;
Program in SAS studio looks like this
We use the blood dataset. We first create the formats normal and high for the cholgrp in the proc format step. The first proc freq step computes the frequency of the cholgrp without taking into account the missing values. The nocum statement suppresses the display of cumulative frequencies and percentages in one-way frequency tables. The format statement associates formats with the variable cholgrp. In the second proc freq step the frequency of the missing values is also computed. The missing statement treats missing values as a valid nonmissing level for all TABLES variables. The nocum statement suppresses the display of cumulative frequencies and percentages in one-way frequency tables. The format statement associates formats with the variable cholgrp.
The output for the above SAS program is as follows
Chapter 17 Question 7 : Using the SAS data set Blood, produce a table of frequencies for BloodType, in frequency order.
The SAS program is as follows.
libname B14003 '/folders/myfolders/Assignment/B14003';
title "Blood Types in Decreasing Frequency Order";
proc freq data=B14003.B03_blood order=freq;
tables BloodType / nocum nopercent;
run;
Program in SAS studio looks like this
We use the blood dataset.In the proc freq step we compute the frequencies of the varibale BloodType. The nocum statement suppresses the display of cumulative frequencies and percentages in one-way frequency tables. The nopercent suppresses the display of overall percentages in crosstabulation tables. The order statement Specifies the order of the variable levels in the frequency and crosstabulation tables, which you request in the TABLES statement.
The output of the above SAS program is as follows.
Chapter 20 Question 5 : Using the SAS data set Bicycles, produce a vertical bar chart showing a frequency distribution of State. Within each bar, show the distribution of Model.
The SAS program is as follows.
libname B14003 '/folders/myfolders/Assignment/B14003';
title "Distribution of Sales by Model";
proc sgplot data=B14003.B03_bicycles;
vbar State / group = Model;
run;
quit;
Program in SAS studio looks like this
We use the bicycles dataset. The proc sgplot step is used to create the charts. The vbar statement creates a vertical bar chart that summarizes the values of a category variable State. The group statement specifies a variable that is used to group the data. The plot elements for each group value are automatically distinguished by different visual attributes. In this case it is grouped by the variable Model.
The output for the SAS program is as follows.
No comments:
Post a Comment